
 en
en  Español
 عربى
عربى
Anemometer with Data Logger: The Complete Buyer's Guide for HVAC and Wind
When a refrigerator case in a supermarket runs warm but the compressor is healthy, the argument usually moves to airflow. A technician climbs onto the roof, holds a handheld anemometer near the condenser, and reads 2.4 m/s. That number answers one question, but it cannot tell you whether the airflow was 3.0 m/s this morning, whether it drops every time the second compressor stages in, or whether a dirty filter is stealing capacity hour by hour. An anemometer with data logger closes that gap by recording air velocity continuously over hours or days. This guide explains what to compare before you buy one, how to read the logs, and where the tool earns its keep in HVAC and refrigeration work.
Content
- 1 Data Logging Turns Measurements into Evidence
- 2 Key Specifications: What Separates a Service Tool from a Toy
- 3 Sensor Types Compared: Which One Fits Your Work
- 4 Practical Ways to Use a Logging Anemometer in HVAC/R Work
- 5 Reading the Logged Data Like a Service Pro
- 6 Buying Checklist: Match the Anemometer to the Real Job
- 7 Final Verdict
Data Logging Turns Measurements into Evidence
Conclusion first: an anemometer with data logger pays for itself the first time you need to prove that a correction worked. A spot reading is a snapshot; a log file is a time series that shows rate of change, repeating patterns, and responses to events. For a commissioning engineer, the difference is a verbal report versus a documented result.
Take the most common service scenario. A walk-in cooler runs warm and no one agrees on why. You log air velocity across the evaporator for 90 minutes. The trace holds steady at 2.9 m/s while the compressor runs, then drops to 1.8 m/s for 20 seconds after defrost. That pattern points to a defrost termination fault, not a fan failure, and it saves you from replacing a working fan motor on a guess.
What the Logging Core Must Deliver
At a minimum, a useful logging anemometer should offer the following:
- Selectable logging intervals from 1 second to at least 10 minutes
- At least 10,000 data points of internal memory
- CSV export through USB or Bluetooth
- Battery life long enough for a full working day of continuous logging
- A probe and cable that survive normal HVAC site conditions
Key Specifications: What Separates a Service Tool from a Toy
The market is full of cheap anemometers that look professional but fall apart under site conditions. The specifications that separate a service instrument from a toy are velocity range, accuracy, logging resolution, battery time, and environmental tolerance.
| Specification | Vane | Hot-wire | Pitot tube | Ultrasonic |
|---|---|---|---|---|
| Sensing method | Rotating impeller | Heated wire cooling | Differential pressure | Sound transit time |
| Best application | Duct traverses and HVAC service | Low velocity clean air | High velocity ducts | Outdoor long term monitoring |
| Typical accuracy | +/- 2.5% of reading | +/- 1.5% of reading | +/- 2.0% of reading | +/- 1.0% of reading |
| Maximum velocity | 40 m/s | 50 m/s | 80 m/s | 40 m/s |
| Relative price | Low | Moderate | Moderate to high | High |
Accuracy is the first number to verify. A vane instrument rated at plus or minus 2.5 percent of reading can deviate by 0.075 m/s at 3 m/s, which is acceptable for duct balancing but too loose for laboratory-grade ventilation verification. Hot-wire and ultrasonic sensors give tighter low-speed readings, but they cost more and need cleaner air. For routine troubleshooting, a vane probe is the most forgiving choice. Logging resolution matters just as much: a one-second interval captures transient events, while a ten-minute interval is enough for long-term trend monitoring.
Sensor Types Compared: Which One Fits Your Work
The radar chart below scores the four sensor families across five practical criteria. Scores are relative, so treat the result as a directional guide rather than laboratory data.
Relative scores of four anemometer sensor families across five practical criteria.
The radar chart makes the trade-off easy to see. Vane anemometers combine high durability with low cost, which is why they dominate routine service work. Hot-wire sensors lead in accuracy and low-speed response but score worst in durability because the heated element is fragile. Pitot tubes perform well at high velocity but lose resolution below 1 m/s. Ultrasonic units offer top accuracy and good durability at a price that is hard to justify for occasional use. In short, your working velocity range and your tolerance for fragile parts will point to one of these four shapes.
Continuous logging battery life in hours by instrument class.
Battery life often decides whether a model is practical for overnight logging. The bars above show continuous logging battery life in hours for four instrument classes. A basic unit around 24 hours covers a single overnight test. A professional unit up to 200 hours can stay on a roof for a full week. Continuous LCD use and backlighting will reduce these numbers by roughly 25 to 40 percent, so add that margin when you calculate your longest session.
Practical Ways to Use a Logging Anemometer in HVAC/R Work
Start with the evaporator when you suspect poor cooling. Place the sensor downstream of the coil, away from bends, and log air velocity at one-minute intervals for at least one full compressor cycle. The profile should climb quickly on start, hold a stable plateau while the compressor runs, and decay smoothly when it stops. If the plateau drifts downward over three consecutive cycles, the coil is loading up, the filter is restricting, or frost is forming unevenly.
Move next to the condenser. Face velocity across the condenser coil directly controls heat rejection. A clean condenser with adequate airflow should hold the manufacturer specification, and a logged drop of 20 percent or more is a reliable warning of a dirty coil, a weak fan, or a blocked recirculation path.
Return air measurement completes the picture. Place a second logging instrument at the return grille while the first unit stays on the supply side. The difference between the two logged averages, read against the fan curve, isolates the performance of the fan itself.
When the airflow data points to a system that cannot breathe, check the refrigerant side in the same visit. The air conditioner fluorine charging pressure gauge provides high side and low side pressures that line up with the airflow log, and a refrigerant leak detector confirms whether a slow airflow decline is actually a refrigerant containment problem in disguise. Pairing the two data sets separates a fan problem, a coil problem, and a refrigerant problem in a single trip.
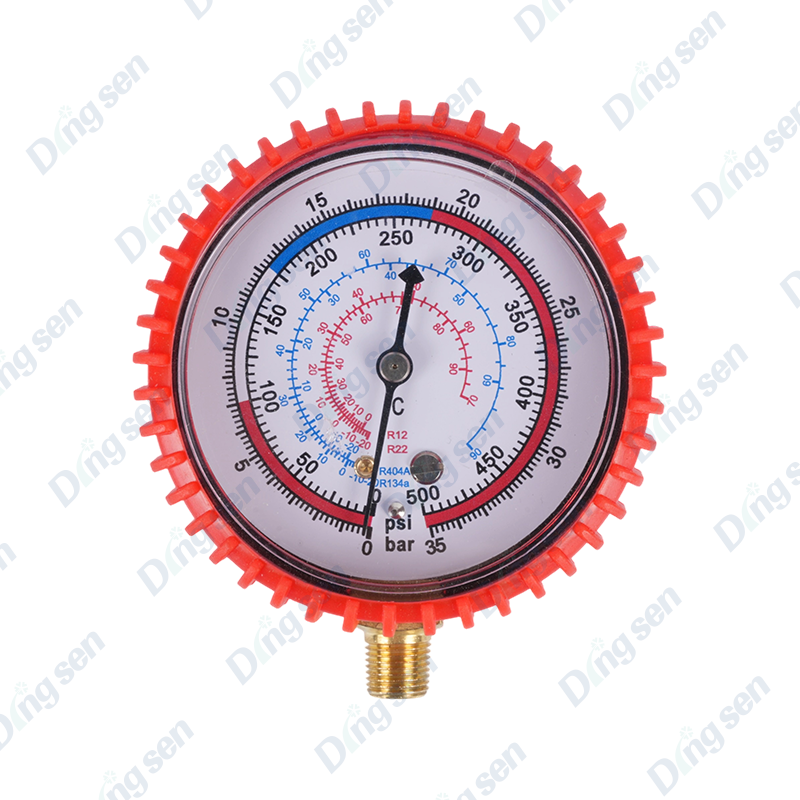 Air Conditioner Refrigerant Charging Pressure Gauge with High-Low Side ReadingsThis pressure gauge displays real-time high and low side pressures and includes temperature-pressure curves for common refrigerants, helping you verify whether the airflow log reflects a refrigerant charge issue during the same service visit.View Product →
 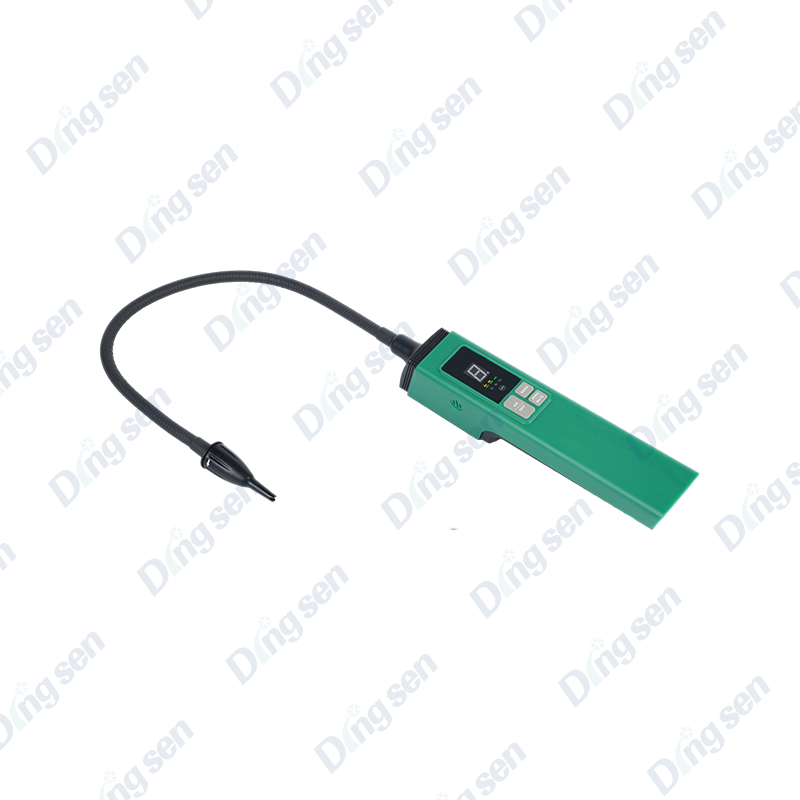 Refrigerant Leak Detector for HVAC Systems with High Sensitivity SensorUse this leak detector alongside the gauge to confirm whether a slow airflow decline is caused by refrigerant loss. It quickly locates leaks with high accuracy and resistance to interference, aiding single-trip diagnosis.View Product →
Reading the Logged Data Like a Service Pro
The line chart below is a ten-hour log from a split system on a summer weekday. The teal line is supply airflow and the amber line is return airflow. Each plotted point is a one-minute average.
Ten hour airflow log from a split air conditioning system; supply and return shown together.
The logged traces reveal what a single reading never can. Both lines stay close together, which means the duct system is not developing a restriction between supply and return. The supply line drifts from 1.2 m/s at noon to 1.05 m/s at 18:00; that gradual slope is the classic signature of a loading filter or an icing coil. The gap between supply and return remains nearly constant, so the fan itself is holding its curve. If the gap had widened, a blocked return grille or a collapsed duct would be the likely cause. A healthy system produces a flat trace; a declining trace tells you that something is consuming fan headroom before you even open the access door.
When the air side is confirmed healthy but the space still will not hold temperature, the refrigerant circuit is the next suspect. Solenoid valve stickiness is a recurring cause in multi-zone systems, and our article on long term stable operation of EVR solenoid valves explains the symptoms to listen for and the tests to run.
Buying Checklist: Match the Anemometer to the Real Job
The column chart below compares typical relative prices of the four sensor families, with a vane instrument set to 1.0.
Typical relative price ladder for the four sensor families.
The column chart shows the price ladder you can expect. A vane device at 1.0 is the baseline that most service budgets start from. Hot-wire instruments sit around 2.5 times that cost, and pitot-based loggers roughly 4 times. Ultrasonic units reach almost 6 times, reflecting their precision parts and internal processing. Unless your specification demands ultra-low-speed accuracy or outdoor-grade weatherproofing, the vane family gives you the most capability per dollar.
Whatever you choose, confirm the details before buying:
- Sensor type that matches your lowest expected velocity. Do not pay for an ultrasonic if you never measure below 0.5 m/s.
- Memory size in data points, and whether the logging interval can be changed in the field.
- Battery time at the logging rate you plan to use, plus the effect of the backlight.
- Data export format and whether the software works with your phone, tablet, or laptop.
- Availability of replacement probes, calibration service, and spare parts.
A calibration certificate is worth paying for when the data may be reviewed by an external auditor or used in a warranty claim. And before you settle on a model, talk to a manufacturer directly. You can contact our team with your expected velocity range, logging duration, and site conditions, and we can confirm which model fits your budget and application.
Final Verdict
Buy the best vane anemometer with data logger you can afford. Keep the logging interval short enough to catch transient events, and form the habit of writing down what you changed on site while the log is still running. That routine turns a service visit into a documented case. If your work regularly goes below 0.5 m/s, invest in a hot-wire model instead. If you need week-long outdoor monitoring, consider an ultrasonic unit with an industrial enclosure. For the majority of HVAC and refrigeration service work, the vane instrument paired with a reliable logger is the right balance of accuracy, durability, price, and ease of use.
-
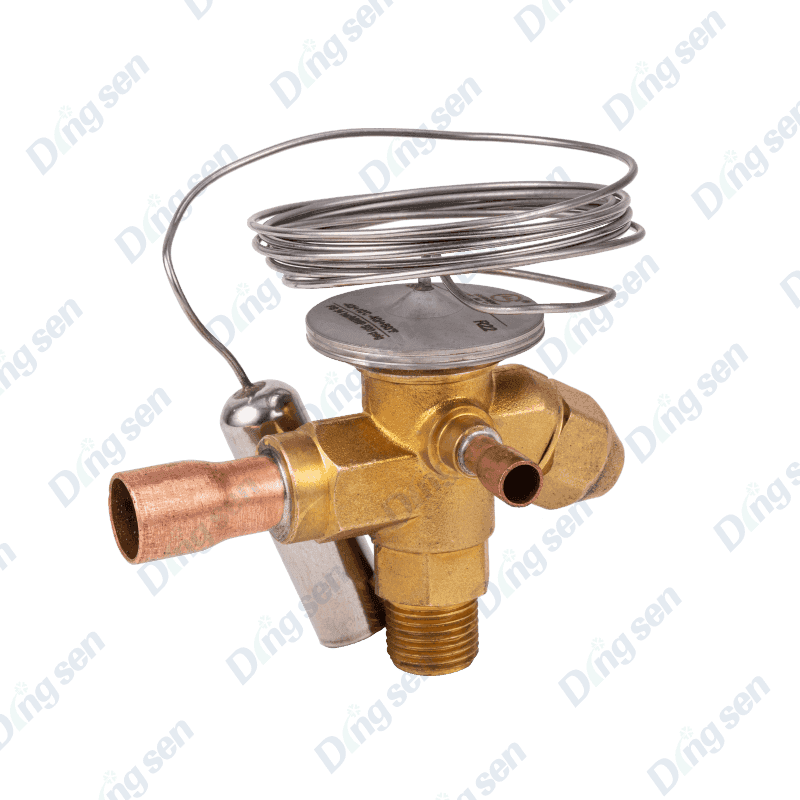
The thermal expansion valve features a compact body constructed of brass or stai...
-
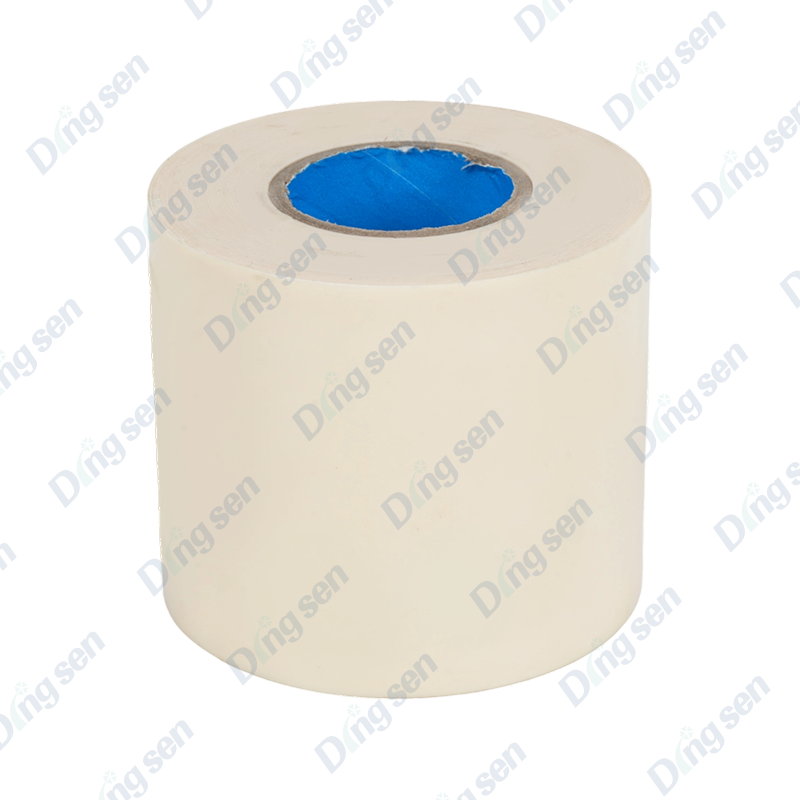
Air conditioning pipe bandage strip is used to secure and protect the pipes conn...
-
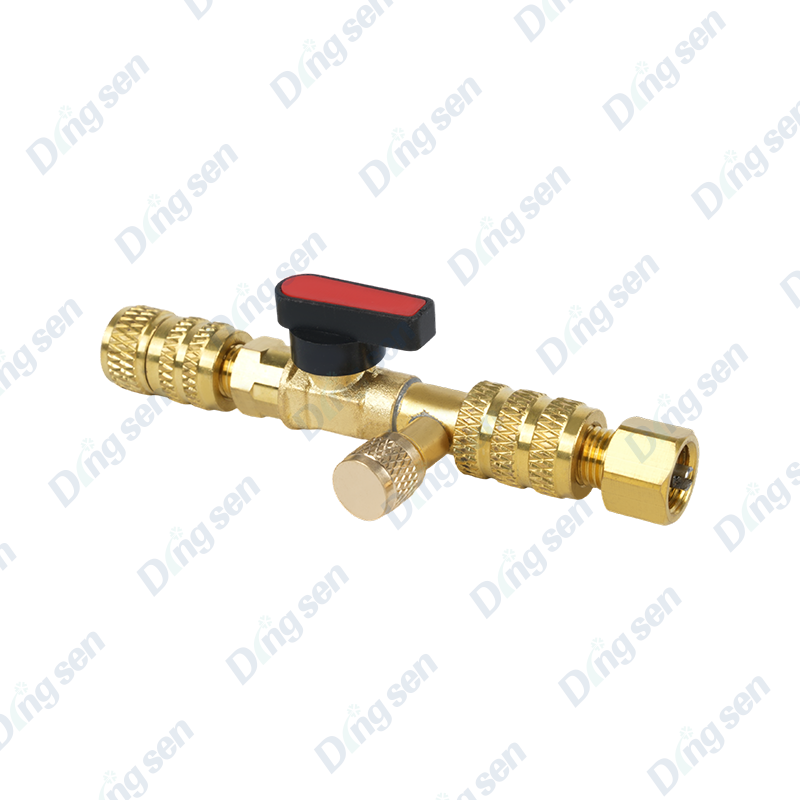
Valve core installation and removal tools are specialized tools for installing a...
-
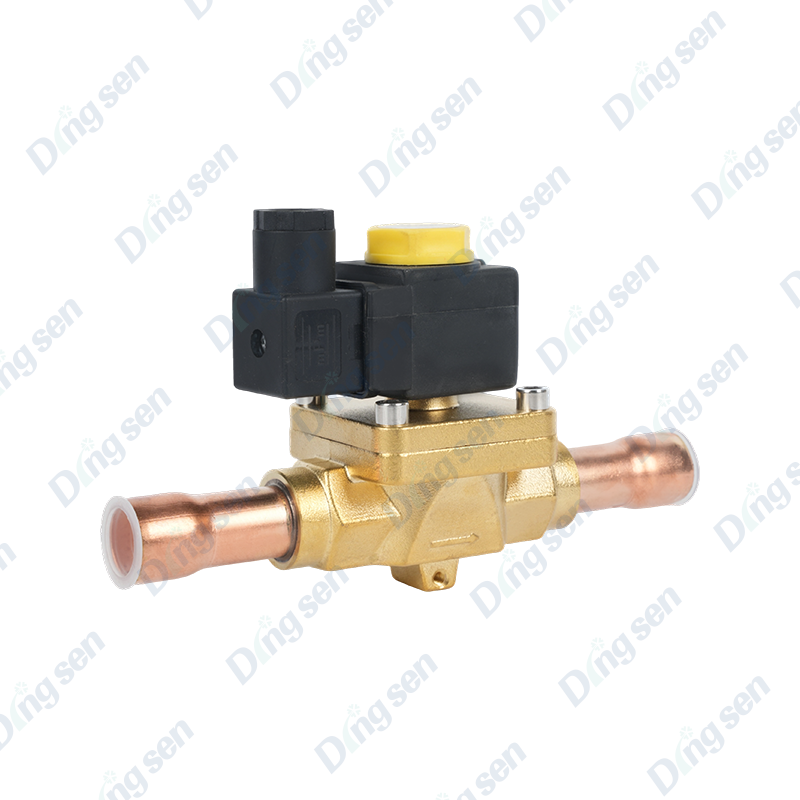
EVR solenoid valves are key components in refrigeration and air conditioning, co...
-
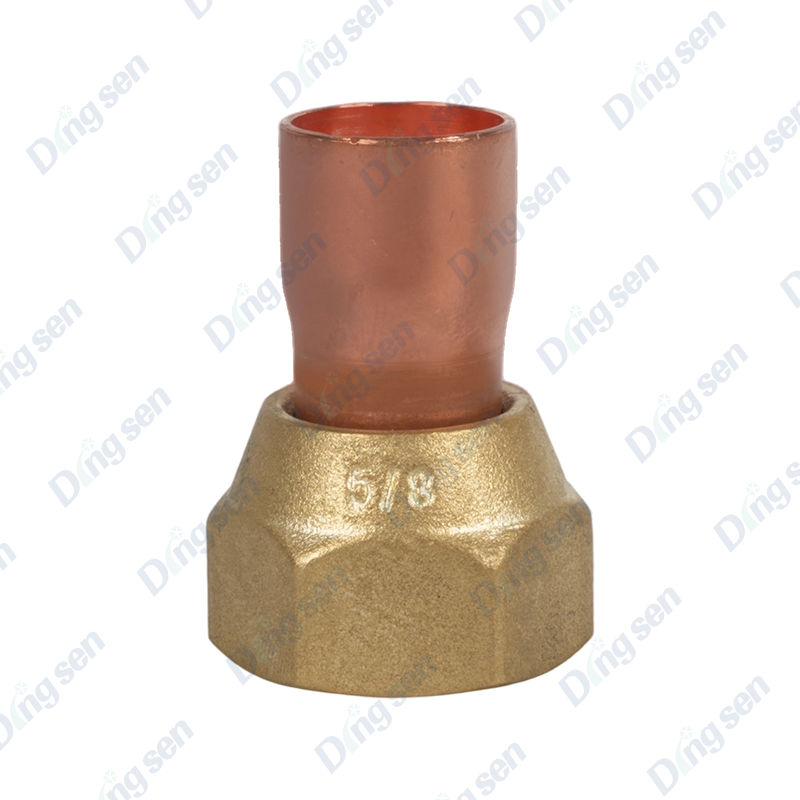
The cup shaped air conditioning copper pipe connector is a high-performance acce...
-
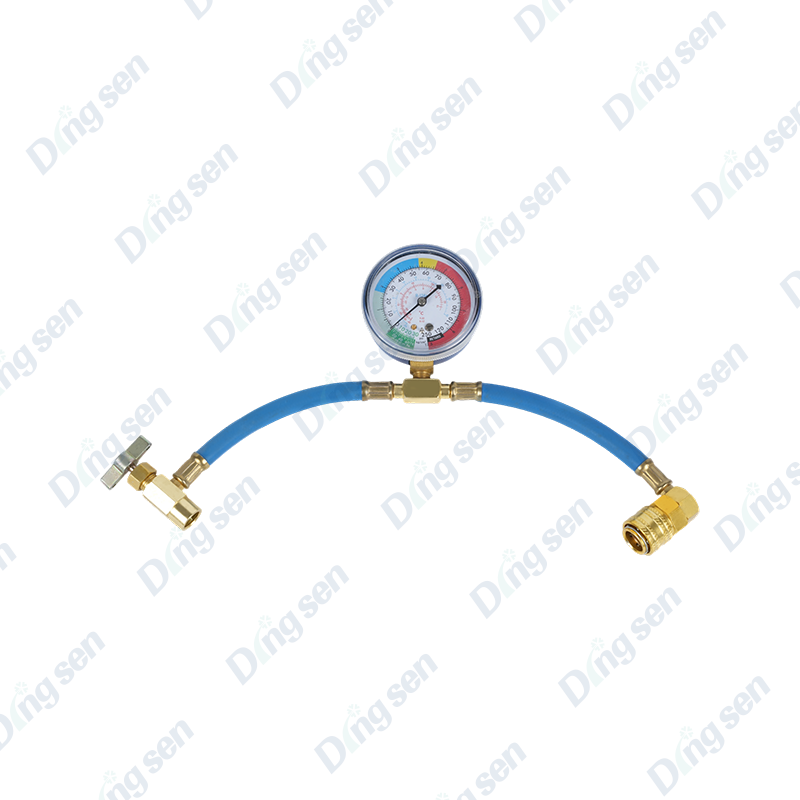
Pressure gauge automotive air conditioning filling system are designed specifica...

Contact Us
-

No. 109 Jiefang Road, Diankou Town, Zhuji City, Shaoxing, Zhejiang Province
-

+86-13867581196
-

Copyright © shaoxing DingSen Refrigeration Technology Co Ltd. All Rights Reserved
OEM Refrigeration Parts Manufacturer Custom Automotive AC Parts Factory